The purpose of this page is just to serve as todo or scratch pad for the development project and to list and share some ideas.
After making changes to the code and/or documentation, this page should remain on the website as a reminder of what was done and how it was done. However, there is no guarantee that this page is updated in the end to reflect the final state of the project
So chances are that this page is considerably outdated and irrelevant. The notes here might not reflect the current state of the code, and you should not use this as serious documentation.
Visualization concept for 4D bivariate data
Goals
- Provide the various plotting functions with a unified (as much as possible) way to handle chan_chan_freq_time data.
- Provide options to plot data of this format using averages and singletons of different dimensions, i.e. plot a single frequency or time point, or the mean of two frequencies or time points across time or frequency space using the ft_singleplot, and ft_multiplot frameworks.
- Provide an interactive plotting scenario which capitalizes on 1) and 2)
Explanation of Diagram
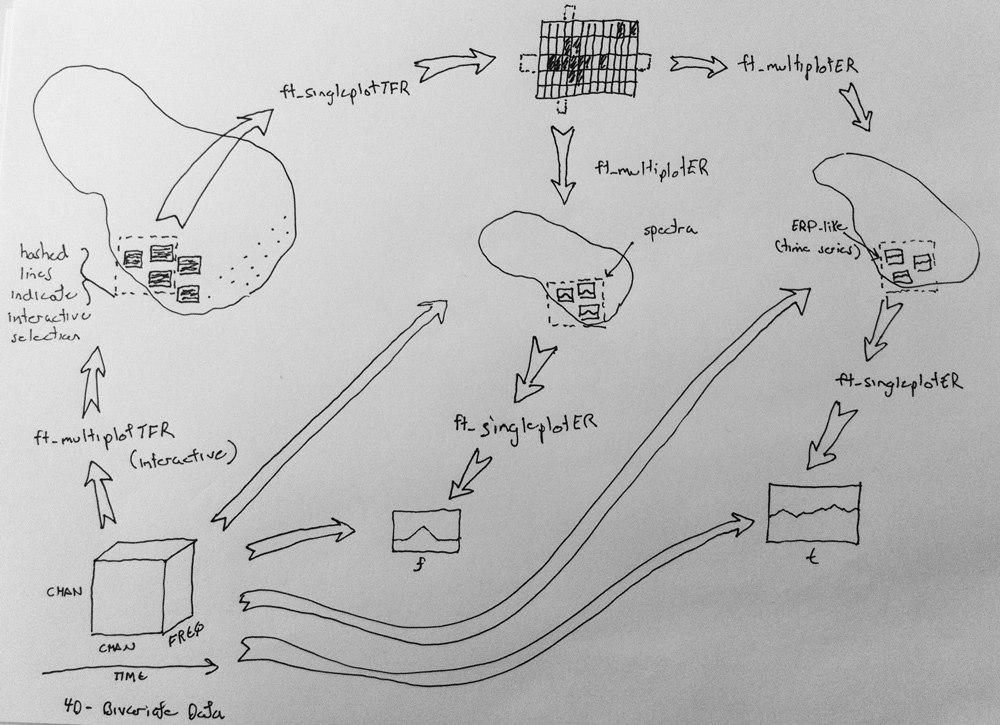
The figure below depicts a flow from the 4D bivariate data (chan_chan_freq_time) itself, represented as the ‘time-varying cube’ in the bottom left hand corner, through various visualization scenarios.
There are 3 visualization path
- the data is visualized via ft_multiplotTFR -> a subset of TFRs are selected which are displayed via ft_singleplotTFR -> here JM had a cool idea that works like this: if an entire row or column is selected interactively, then this spawns the ft_multiplotER routine which displays the selected singleton or averaged data on a time or frequency axis (this depending on the orientation of the selected region) -> further selection of the multiplots can be made, which generate single plots
- Go directly to ft_multiplotER representations in time or frequency space.
- Go directly to ft_singleplotER representations in time or frequency space.
Sample Data For Development
a link to sample data will be provided here
Steps to be taken
- Inventorise how (dis)similar the different high-level plotting routines are, in particular with respect how the data are handled. The intention should be that the backbones of the functions should be very similar (particularly between the singleplotXXX, between the topoplotXXX and between the multiplotXXXs).
- Make the backbones as identical as possible
- Implement a generic way of data handling