Does it make sense to subtract the ERP prior to time frequency analysis, to distinguish evoked from induced power?
Introduction
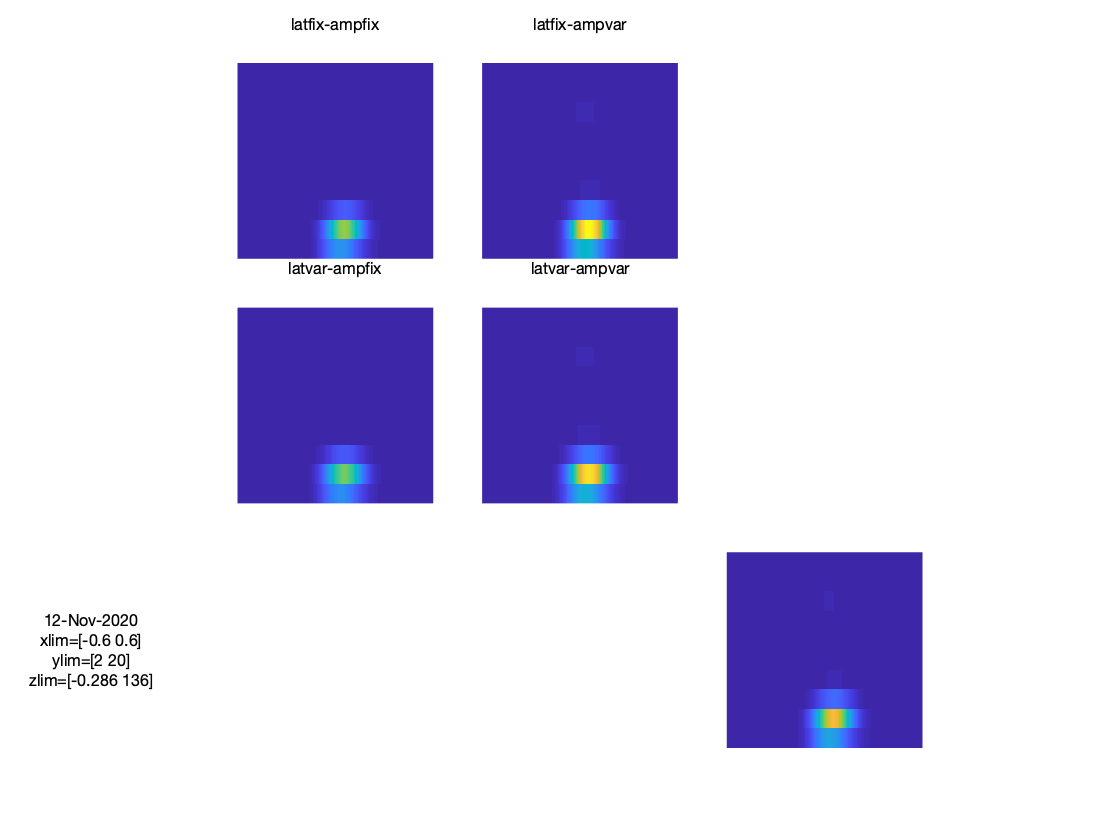
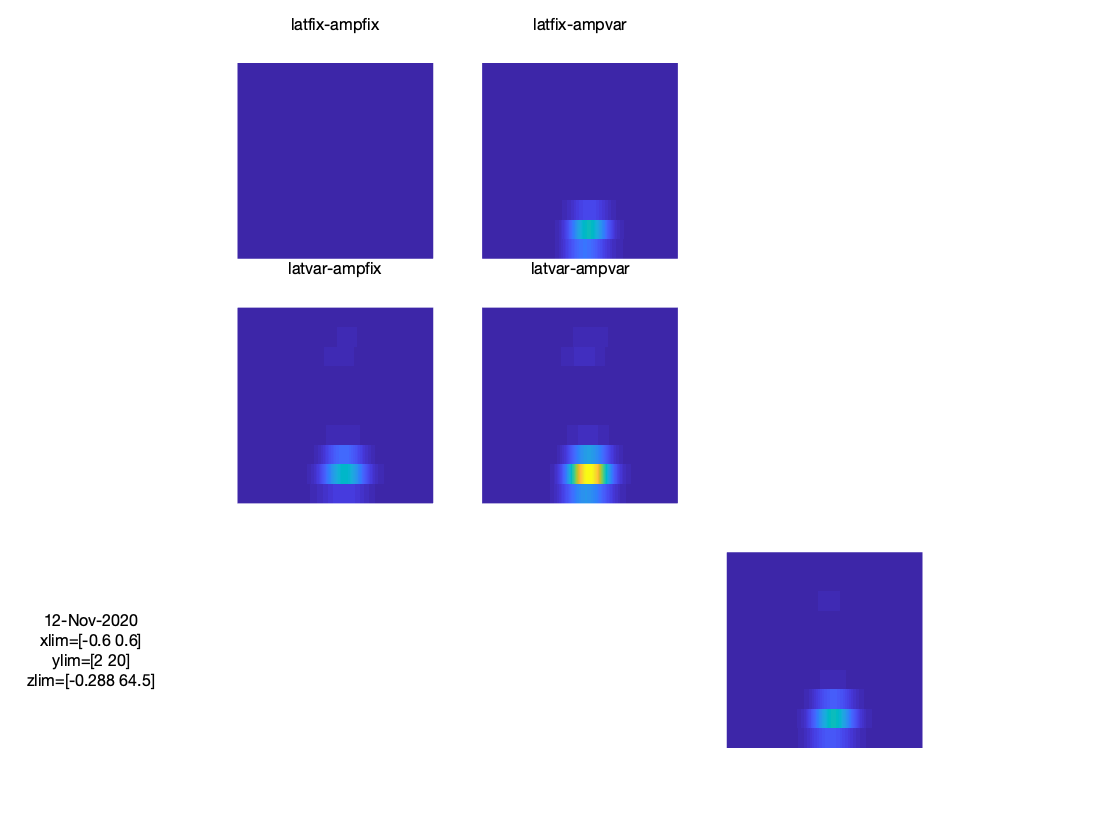
When interpreting the time-frequency representation of the data, one needs to be aware of the fact that transient signal components (often denoted as phase-locked, or evoked components) contribute to the TFR. Sometimes one wishes to distinguish between stimulus-induced and stimulus-evoked activity in the interpretation of the results. For instance, if an observed effect in the data can be explained in terms of changes in power of ongoing rhythmic activity (induced). To make this distinction, it has been suggested to subtract the trial-averaged ERP/ERF from the data, prior to computing the time-frequency representation. One could seriously question the validity of this suggested subtraction, because the ERP is not a robot-like repetition of exactly the same transient on each and every trial. Rather, the ERP is by definition the average across trials, and thus averages out trial-specific noise (as intended), but also averages out trial-specific morphological differences of the transient (slight jitter in latency and/or amplitude from one trial to the next). The toy example provide below demonstrates the effect of ERP subtraction on the resulting TFR. As can be seen, if the transient is super constant across trials, the subtraction method makes sense, but once the transient becomes variable across trials (i.e. introducing trial-specific latency shifts and amplitude variations) the subtraction does not work anymore.
Example code
step 1: create a signal (ongoing alpha) + some noise
n = 100;
x = randn(n,2000);
x = ft_preproc_bandpassfilter(x, 1000, [8 12], [], 'firws');
x = x+randn(n,2000)./10;

y = x;
z = x;
q = x;
step 2: create a transient and add this to the ongoing signal in 4 flavours
transient = (sin((2.*pi.*(0:149))./150)).*[ones(1,75) ones(1,75)./2];
for k = 1:size(y,1)
  % add a transient around 0-150 ms -> jittered case
  % add a transient around 0-150 ms -> jittered case + variable amplitude
  jitter = randi(80,1,1)-40;
  amp    = rand(1,1).*0.5;
  y(k,(1001:1150)+jitter) = y(k,(1001:1150)+jitter)+0.25.*transient;
  z(k,(1001:1150)+jitter) = z(k,(1001:1150)+jitter)+amp.*transient;

  % add a transient at 0-150 ms -> ideal case
  x(k,1001:1150) = x(k,1001:1150)+0.25.*transient;

  % add a variable amplitude transient
  q(k,1001:1150) = q(k,1001:1150)+amp.*transient;

end
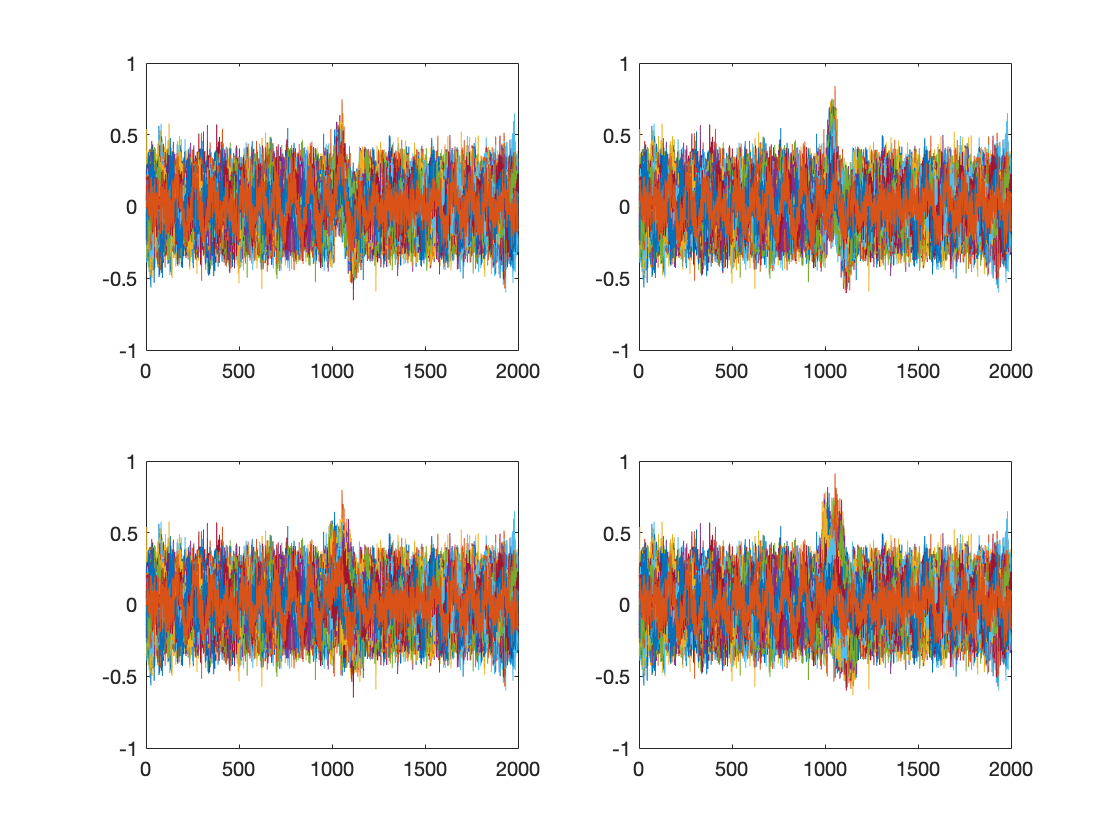
subplot(2,2,1);plot(x'); abc = axis;
subplot(2,2,2);plot(q'); axis(abc);
subplot(2,2,3);plot(y'); axis(abc);
subplot(2,2,4);plot(z'); axis(abc);
Figure 1: simulated data on 4 channels, each with a slightly different transient superimposed on ongoing activity
step 3: create an ft-like data structure
data = [];
data.trial = cell(1,n);
data.time  = cell(1,n);
for k = 1:n
  data.trial{k} = [x(k,:);q(k,:);y(k,:);z(k,:)];
  data.time{k}  = ((0:1999)./1000)-1;
end

data.label = {'latfix-ampfix';'latfix-ampvar';'latvar-ampfix';'latvar-ampvar'};
step 4: estimate the ERP
tlck = ft_timelockanalysis([], data);
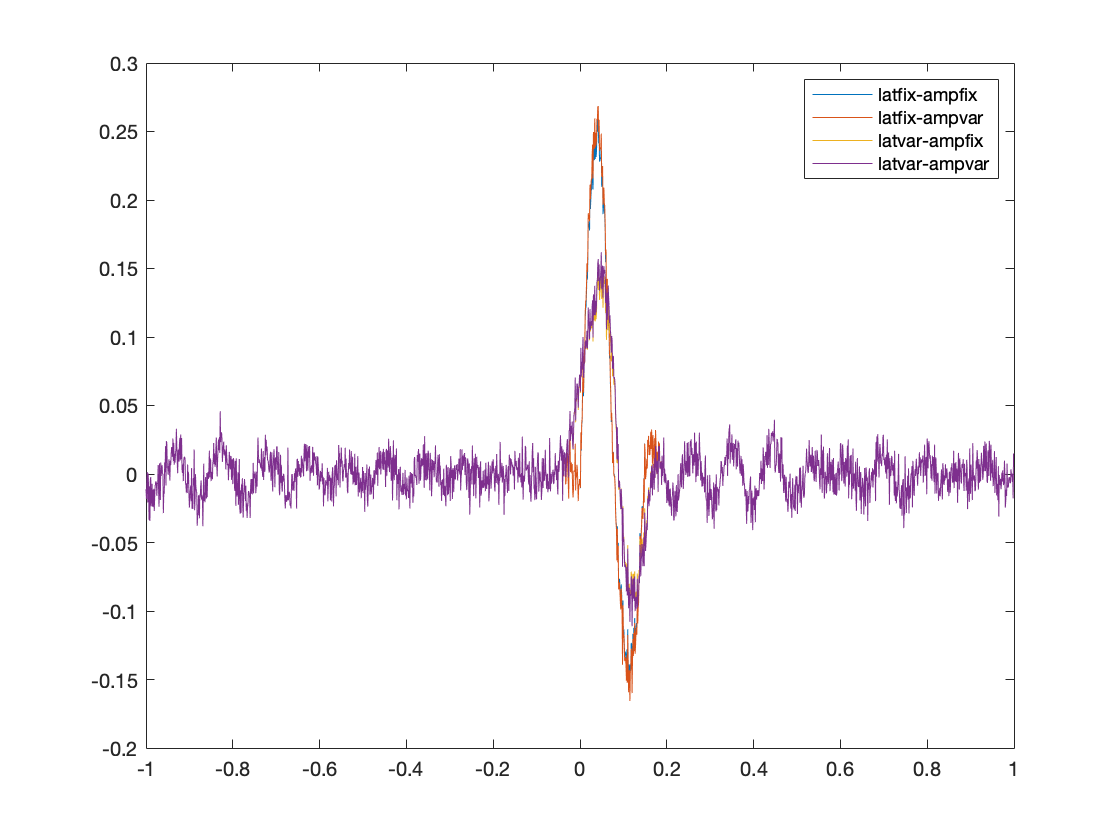
figure;plot(tlck.time, tlck.avg); legend(tlck.label);
Figure 2: ERP
step 5: subtract the ERP from the data
data_minus_erp = data;
for k = 1:numel(data.trial)
  data_minus_erp.trial{k} = data.trial{k} - tlck.avg;
end
step 6: perform time-frequency decomposition
cfg = [];
cfg.method = 'mtmconvol';
cfg.foi = 2:2:20;
cfg.output = 'pow';
cfg.toi = data.time{1};

cfg.t_ftimwin = ones(1,numel(cfg.foi)).*0.5;
cfg.taper = 'hanning';
cfg.keeptrials = 'yes';
freq = ft_freqanalysis(cfg, data);
freq_minus_erp = ft_freqanalysis(cfg, data_minus_erp);

fd = ft_freqdescriptives([], freq);
fd_minus_erp = ft_freqdescriptives([] ,freq_minus_erp);
step 7: express power relative to a baseline
cfg = [];
cfg.baseline = [-0.6 -0.2];
cfg.baselinetype = 'relchange';
fd = ft_freqbaseline(cfg, fd);
fd_minus_erp = ft_freqbaseline(cfg, fd_minus_erp);
step 8: create an ordered layout for the 4 channels
cfg = [];
cfg.layout = 'ordered';
cfg.rows   = 2;
cfg.columns = 2;
layout = ft_prepare_layout(cfg, fd);
step 9: visualize the results
cfg = [];
cfg.xlim    = [-0.6 0.6]; % avoid plotting the filter edges
cfg.layout = layout;
cfg.showlabels = 'yes';
ft_multiplotTFR(cfg,fd); % note there's an issue with recent versions (i.e. mid 2020) of ft_multiplotTFR so one needs the latest version of FT for this to work
ft_multiplotTFR(cfg,fd_minus_erp);
Figure 3: TRF
Figure 4: TRF after ERP subtraction


