Statistical analysis and multiple comparison correction for combined MEG/EEG data
Introduction
The objective of this tutorial is to give an introduction to the statistical analysis of MEG data using different methods to control for the false alarm rate. The tutorial starts with sketching the background of cluster-based permutation tests. Subsequently it is shown how to use FieldTrip to perform statistical analysis (including cluster-based permutation tests) on the time-frequency response to a movement, and to the auditory mismatch negativity. The tutorial makes use of a between-trials (within-subject) design.
In this tutorial we will continue working on the dataset described in the Preprocessing and event-related activity and the Time-frequency analysis of MEG and EEG tutorials. We will repeat some code here to select the trials and preprocess the data. We assume that the preprocessing and the computation of the ERFs/TFRs are already clear to the reader.
This tutorial is not covering group analysis. If you are interested in that, you can read the other tutorials that cover cluster-based permutation tests on event-related fields and on time-frequency data. If you are interested in a more gentle introduction as to how parametric statistical tests can be used with FieldTrip, you can read the Parametric and non-parametric statistics on event-related fields tutorial.
This tutorial contains the hands-on material of the NatMEG workshop. The background is explained in this lecture, which was recorded at the Aston MEG-UK workshop.
Background
The topic of this tutorial is the statistical analysis of multi-channel MEG data. In cognitive experiments, the data is usually collected in different experimental conditions, and the experimenter wants to know whether there is a difference in the data observed in these conditions. In statistics, a result (for example, a difference among conditions) is statistically significant if it is unlikely to have occurred by chance according to a predetermined threshold probability, the significance level.
An important feature of the MEG and EEG data is that it has a spatial temporal structure, i.e. the data is sampled at multiple time-points and sensors. The nature of the data influences which kind of statistics is the most suitable for comparing conditions. If the experimenter is interested in a difference in the signal at a certain time-point and sensor, then the more widely used parametric tests are also sufficient. If it is not possible to predict where the differences are, then many statistical comparisons are necessary which lead to the multiple comparisons problem (MCP). The MCP arises from the fact that the effect of interest (i.e., a difference between experimental conditions) is evaluated at an extremely large number of (channel,time)-pairs. This number is usually in the order of several thousands. Now, the MCP involves that, due to the large number of statistical comparisons (one per (channel,time)-pair), it is not possible to control the so called family-wise error rate (FWER) by means of the standard statistical procedures that operate at the level of single (channel,time)-pairs. The FWER is the probability, under the hypothesis of no effect, of falsely concluding that there is a difference between the experimental conditions at one or more (channel,time)-pairs. A solution of the MCP requires a procedure that controls the FWER at some critical alpha-level (typically, 0.05 or 0.01). The FWER is also called the false alarm rate.
When parametric statistics are used, one method that addresses this problem is the so-called Bonferroni correction. The idea is if the experimenter is conducting n number of statistical tests then each of the individual tests should be tested under a significance level that is divided by n. The Bonferroni correction was derived from the observation that if n tests are performed with an alpha significance level then the probability that one comes out significantly is smaller than or equal to n times alpha (Boole’s inequality). In order to keep this probability lower, we can use an alpha that is divided by n for each test. However, the correction comes at the cost of increasing the probability of false negatives, i.e. the test does not have enough power to reveal differences among conditions.
In contrast to the familiar parametric statistical framework, it is straightforward to solve the MCP in the nonparametric framework. Nonparametric tests offer more freedom to the experimenter regarding which test statistics are used for comparing conditions, and help to maximize the sensitivity to the expected effect. For more details see the publication by Maris and Oostenveld (2007).
Procedure
The preprocessing and time-frequency computation is similar to how it is done in the previous tutorials, and hence not explained in further detail.
The MEG dataset that we use in this tutorial is available as oddball1_mc_downsampled.fif from our download server. Furthermore, you should download and save the custom trial function trialfun_oddball_responselocked.m to a directory that is on your MATLAB path.
Preprocessing the response-locked data
cfg = [];
cfg.dataset = 'oddball1_mc_downsampled.fif';

% define trials based on response
cfg.trialdef.prestim       = 1.0;
cfg.trialdef.poststim      = 2.0;
cfg.trialdef.stim_triggers = [1 2];
cfg.trialdef.rsp_triggers  = [256 4096];
cfg.trialfun               = 'trialfun_oddball_responselocked';
cfg                        = ft_definetrial(cfg);

% preprocess MEG data
cfg.channel = 'MEG*1';
cfg.continuous             = 'yes';
cfg.demean                 = 'yes';
cfg.dftfilter              = 'yes';
cfg.dftfreq                = [50 100];

data_responselocked        = ft_preprocessing(cfg);
Averaged time-frequency responses
cfg           = [];
cfg.output    = 'pow';
cfg.method    = 'mtmconvol';
cfg.taper     = 'hanning';
cfg.toi       = 0.0 : 0.1 : 1.0;
cfg.foi       = 12:24;
cfg.t_ftimwin = ones(size(cfg.foi)) * 0.5;

cfg.trials    = find(data_responselocked.trialinfo(:,1) == 256);
TFR_left      = ft_freqanalysis(cfg, data_responselocked);

cfg.trials    = find(data_responselocked.trialinfo(:,1) == 4096);
TFR_right     = ft_freqanalysis(cfg, data_responselocked);

cfg = [];
cfg.baseline     = [0 0];
cfg.baselinetype = 'absolute';
cfg.layout       = 'neuromag306mag.lay';

figure;
ft_multiplotTFR(cfg, TFR_left);

figure;
ft_multiplotTFR(cfg, TFR_right);
Compute contrast between response hands
cfg = [];
cfg.parameter = 'powspctrm';
cfg.operation = '(x1-x2)/(x1+x2)';
TFR_diff      = ft_math(cfg, TFR_right, TFR_left);

cfg = [];
cfg.marker  = 'on';
cfg.layout  = 'neuromag306mag.lay';
cfg.channel = 'MEG*1';
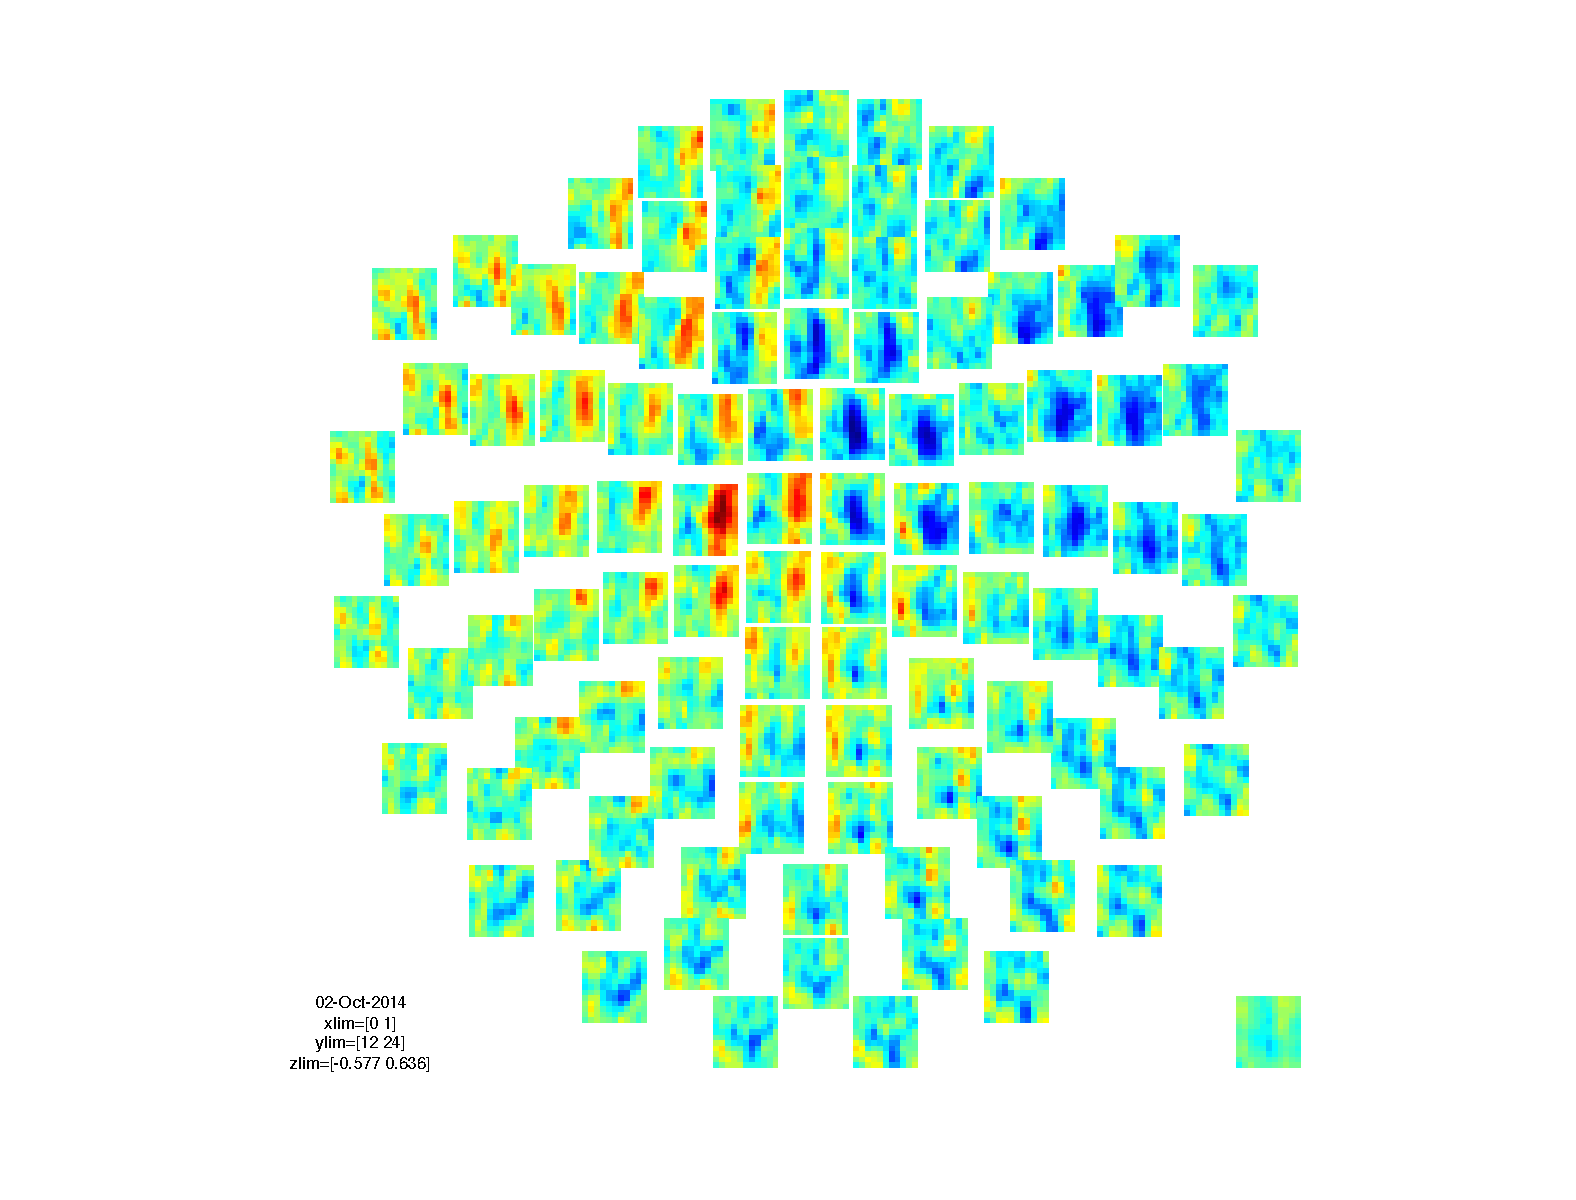
figure; ft_multiplotTFR(cfg, TFR_diff);
Single-trial time-frequency responses
To perform the statistical test we need to compute single-trial time-frequency responses. This is done using the cfg.keeptrials configuration option, which by default is ‘no’. Since we compute the TFR for each individual trial, we don’t have to split the data in the two conditions. The condition to which each trial belongs is kept with the data in the trialinfo field.
cfg              = [];
cfg.output       = 'pow';
cfg.method       = 'mtmconvol';
cfg.taper        = 'hanning';
cfg.toi          = 0.0 : 0.1 : 1.0;
cfg.foi          = 15:25;
cfg.t_ftimwin    = ones(size(cfg.foi)) * 0.5;
cfg.keeptrials   = 'yes';  % keep the TFR on individual trials
TFR_all          = ft_freqanalysis(cfg, data_responselocked);
Let us compare the single-trial TFR with the averaged TFR.
disp(TFR_all)

    label: {102x1 cell}
   dimord: 'rpt_chan_freq_time'
     freq: [14.9800 15.9787 16.9774 17.9760 18.9747 19.9734 20.9720 21.9707 22.9694 23.9680 24.9667]
     time: [0 0.1000 0.2000 0.3000 0.4000 0.5000 0.6000 0.7000 0.8000 0.9000 1.0000]
powspctrm: [4-D double]
cumtapcnt: [100x11 double]
     elec: [1x1 struct]
     grad: [1x1 struct]
trialinfo: [100x2 double]
      cfg: [1x1 struct]

disp(TFR_left)

    label: {102x1 cell}
   dimord: 'chan_freq_time'
     freq: [11.9840 12.9827 13.9814 14.9800 15.9787 16.9774 17.9760 18.9747 19.9734 20.9720 21.9707 22.9694 23.9680]
     time: [0 0.1000 0.2000 0.3000 0.4000 0.5000 0.6000 0.7000 0.8000 0.9000 1.0000]
powspctrm: [102x13x11 double]
     elec: [1x1 struct]
     grad: [1x1 struct]
      cfg: [1x1 struct]
Use the MATLAB boxplot function to plot the power in channel ‘MEG0431’ at 18 Hz and around 700 ms following movement offset.
Hint: you can make a selection of the data like
TFR_all.powspctrm(:, 15, 4, 8)
to give you a vector with the power values in each trial, and you can use the trialinfo as the grouping variable.
Log-transform the single-trial power
Spectral power is not normally distributed. Although this is in theory not a problem for the non-parametric statistical test, its sensitivity is usually increased by log-transforming the values in the power spectrum.
cfg           = [];
cfg.parameter = 'powspctrm';
cfg.operation = 'log10';
TFR_logpow    = ft_math(cfg, TFR_all);
Compute the neighbours
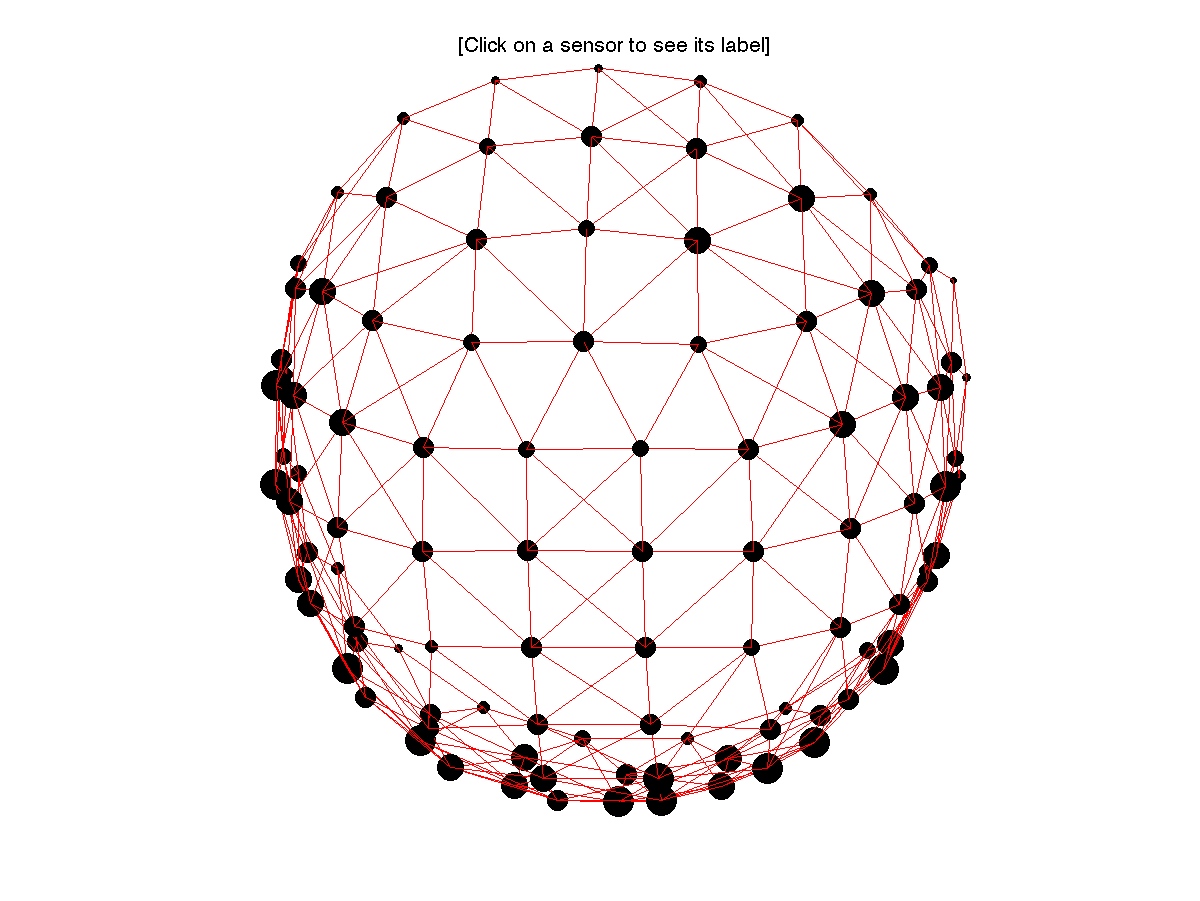
With time-frequency data we have three dimensions in which we can form clusters. In the time and frequency dimension it is trivial how to form the clusters, but the spatial dimension is not regularly represented in the data. Hence we have to construct an explicit description of the neighbourhood of each channel
cfg           = [];
cfg.channel   = 'MEG*1';
cfg.method    = 'triangulation';
cfg.grad      = TFR_all.grad;
cfg.feedback  = 'yes';
neighbours    = ft_prepare_neighbours(cfg);

disp(neighbours(1))

      label: 'MEG0111'
neighblabel: {3x1 cell}
The neighbourhood structure contains for each channel a list of other channels that are considered its neighbours. In case you do not want to cluster over channels, you can specify the neighbours as ‘[]’, i.e. empty.
Compute the statistics
cfg           = [];
cfg.channel   = 'MEG*1';
cfg.statistic = 'indepsamplesT';
cfg.ivar      = 1;
cfg.design    = zeros(1, size(TFR_all.trialinfo,1));

cfg.design(TFR_all.trialinfo(:,1)== 256) = 1;
cfg.design(TFR_all.trialinfo(:,1)==4096) = 2;

cfg.method    = 'analytic';
cfg.correctm  = 'no';
TFR_stat1     = ft_freqstatistics(cfg, TFR_logpow);
The result of ft_freqstatistics is a structure that is organized just like most other FieldTrip structures, i.e. it has a dimord field which explains how the data contained in the structure can be interpreted. This also means that the statistical output can be visualized like any other FieldTrip structure, in this case with ft_multiplotTFR, ft_singleplotTFR or ft_topoplotTFR.
disp(TFR_stat1)

     df: 98
critval: [-1.9845 1.9845]
   stat: [102x11x11 double]
   prob: [102x11x11 double]
   mask: [102x11x11 logical]
 dimord: 'chan_freq_time'
  label: {102x1 cell}
   freq: [14.9800 15.9787 16.9774 17.9760 18.9747 19.9734 20.9720 21.9707 22.9694 23.9680 24.9667]
   time: [0 0.1000 0.2000 0.3000 0.4000 0.5000 0.6000 0.7000 0.8000 0.9000 1.0000]
    cfg: [1x1 struct]
Having computed the probability without correcting for multiple comparisons, we proceed with three methods that do correct for the MCP.
cfg.method    = 'analytic';
cfg.correctm  = 'bonferroni';
TFR_stat2     = ft_freqstatistics(cfg, TFR_logpow);

cfg.method    = 'analytic';
cfg.correctm  = 'fdr';
TFR_stat3     = ft_freqstatistics(cfg, TFR_logpow);

cfg.method            = 'montecarlo';
cfg.correctm          = 'cluster';
cfg.numrandomization  = 500; % 1000 is recommended, but takes longer
cfg.neighbours        = neighbours;
TFR_stat4     = ft_freqstatistics(cfg, TFR_logpow);
Visualise the results
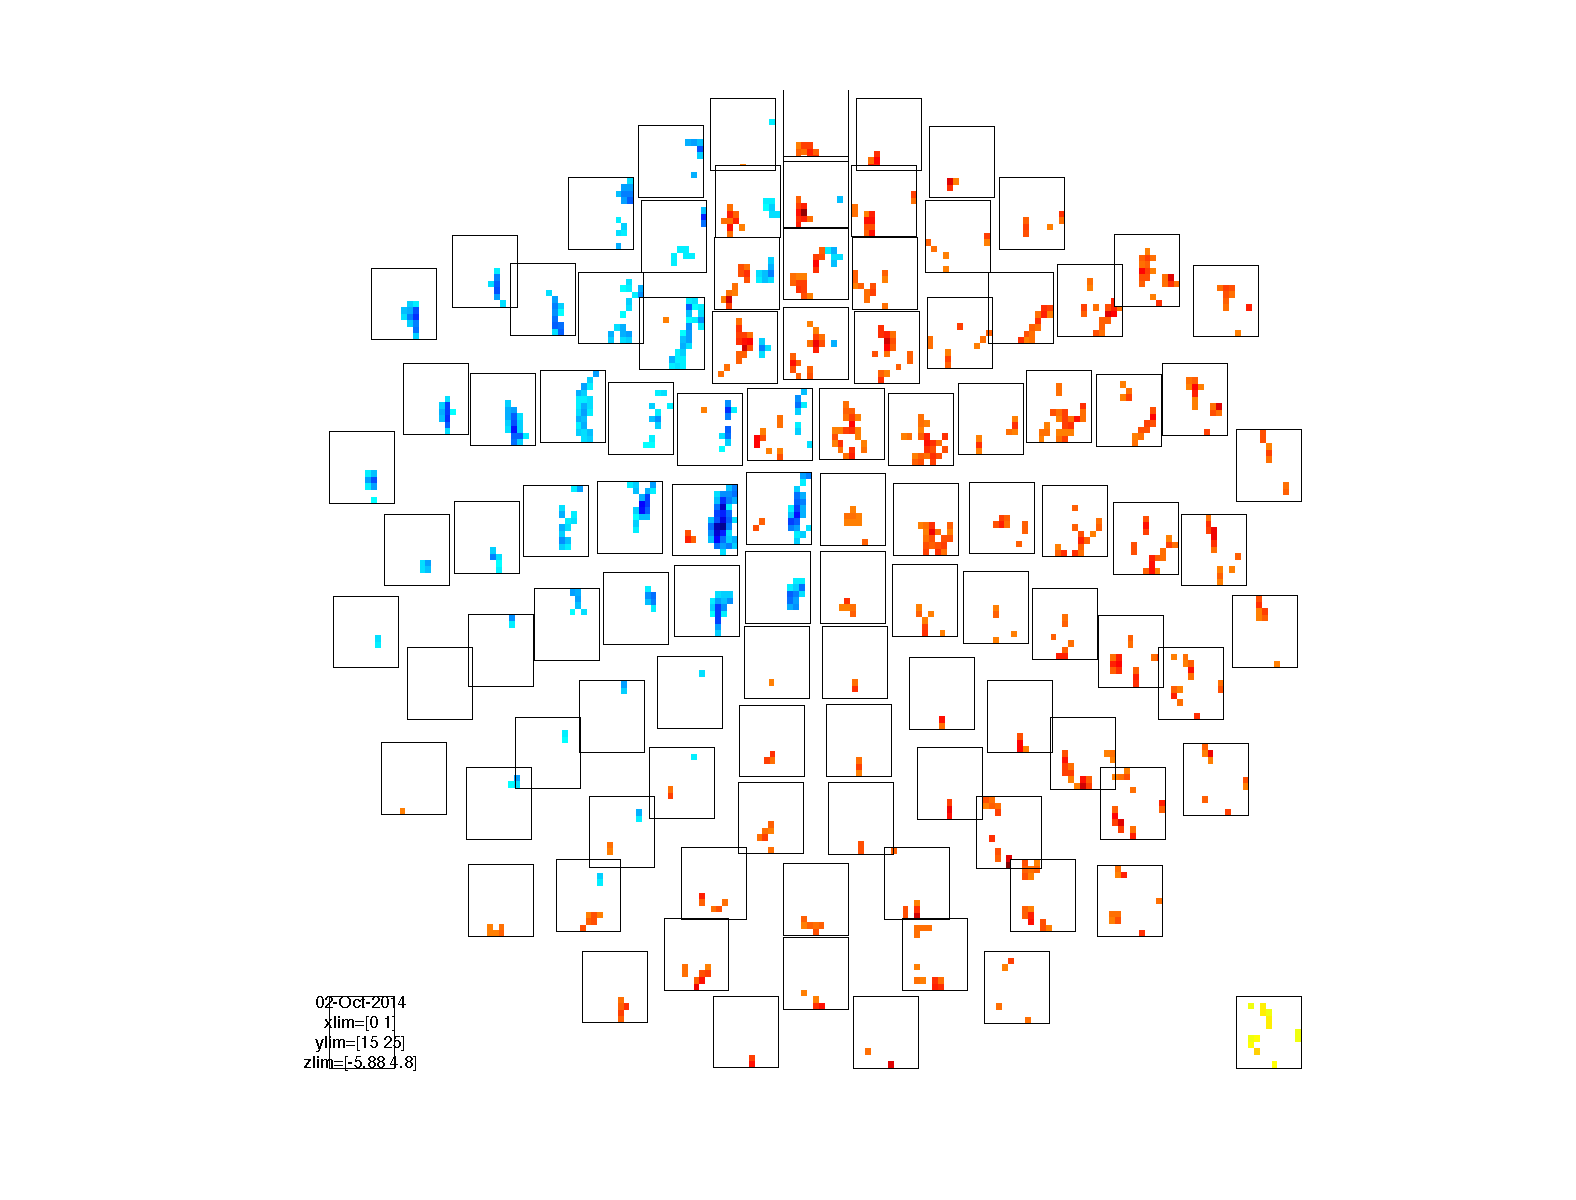
We can visualize the results just like any other TFR structure. The TFR_stat structures contain the actual statistical value that was computed (i.e. the t-value) in the stat field.
cfg               = [];
cfg.marker        = 'on';
cfg.layout        = 'neuromag306mag.lay';
cfg.channel       = 'MEG*1';
cfg.parameter     = 'stat';  % plot the t-value
cfg.maskparameter = 'mask';  % use the thresholded probability to mask the data
cfg.maskstyle     = 'saturation';

figure; ft_multiplotTFR(cfg, TFR_stat1);
figure; ft_multiplotTFR(cfg, TFR_stat2);
figure; ft_multiplotTFR(cfg, TFR_stat3);
figure; ft_multiplotTFR(cfg, TFR_stat4);
Preprocessing the stimulus-locked data
Let us now move on with the stimulus-locked activity, i.e. the auditory event-related fields. The preprocessing is again similar to the previous tutorials.
The following requires that the custom trial function trialfun_oddball_stimlocked.m is present in a directory that is on your MATLAB path.
cfg = [];
cfg.dataset = 'oddball1_mc_downsampled.fif';

% define trials based on stimulus
cfg.trialdef.prestim       = 0.3;
cfg.trialdef.poststim      = 0.7;
cfg.trialdef.stim_triggers = [1 2];
cfg.trialdef.rsp_triggers  = [256 4096];
cfg.trialfun               = 'trialfun_oddball_stimlocked';
cfg = ft_definetrial(cfg);

% preprocess MEG data
cfg.channel           = 'MEG*1';
cfg.continuous        = 'yes';
cfg.demean            = 'yes';
cfg.baselinewindow    = [-inf 0];
cfg.dftfilter         = 'yes';
cfg.dftfreq           = [50 100];

data_stimlocked = ft_preprocessing(cfg);
The oddball effect is rather strong, and with 600 trials (500 standards and 100 oddballs) it would be trivial to find a significant effect. To make the procedure slightly more interesting and informative, we will make a subselection by taking the first 100 trials.
cfg                 = [];
cfg.trials          = 1:100;
data_stimlocked     = ft_selectdata(cfg, data_stimlocked);
After this subselection, there are 84 standard trials and only 16 deviant trials remaining.
We can compute the ERFs for the two experimental conditions by selecting the standard (1) and deviant (2) trigger codes in the trialinfo field.
cfg         = [];
cfg.trials  = find(data_stimlocked.trialinfo(:,1) == 1);
ERF_std     = ft_timelockanalysis(cfg, data_stimlocked);

cfg.trials  = find(data_stimlocked.trialinfo(:,1) == 2);
ERF_dev     = ft_timelockanalysis(cfg, data_stimlocked);
The ft_selectdata function is a very handy general purpose function that allows making selections in any dimension of the data. Furthermore, it allows you to compute averages over any of the dimensions. In case you would need the ERF topography as a vector that is averaged over 80 to 110 ms, you could do
cfg = [];
cfg.latency = [0.08 0.11];
cfg.avgovertime = 'yes';
ERF_peak = ft_selectdata(cfg, ERF_std)
cfg        = [];
cfg.layout = 'neuromag306mag.lay';
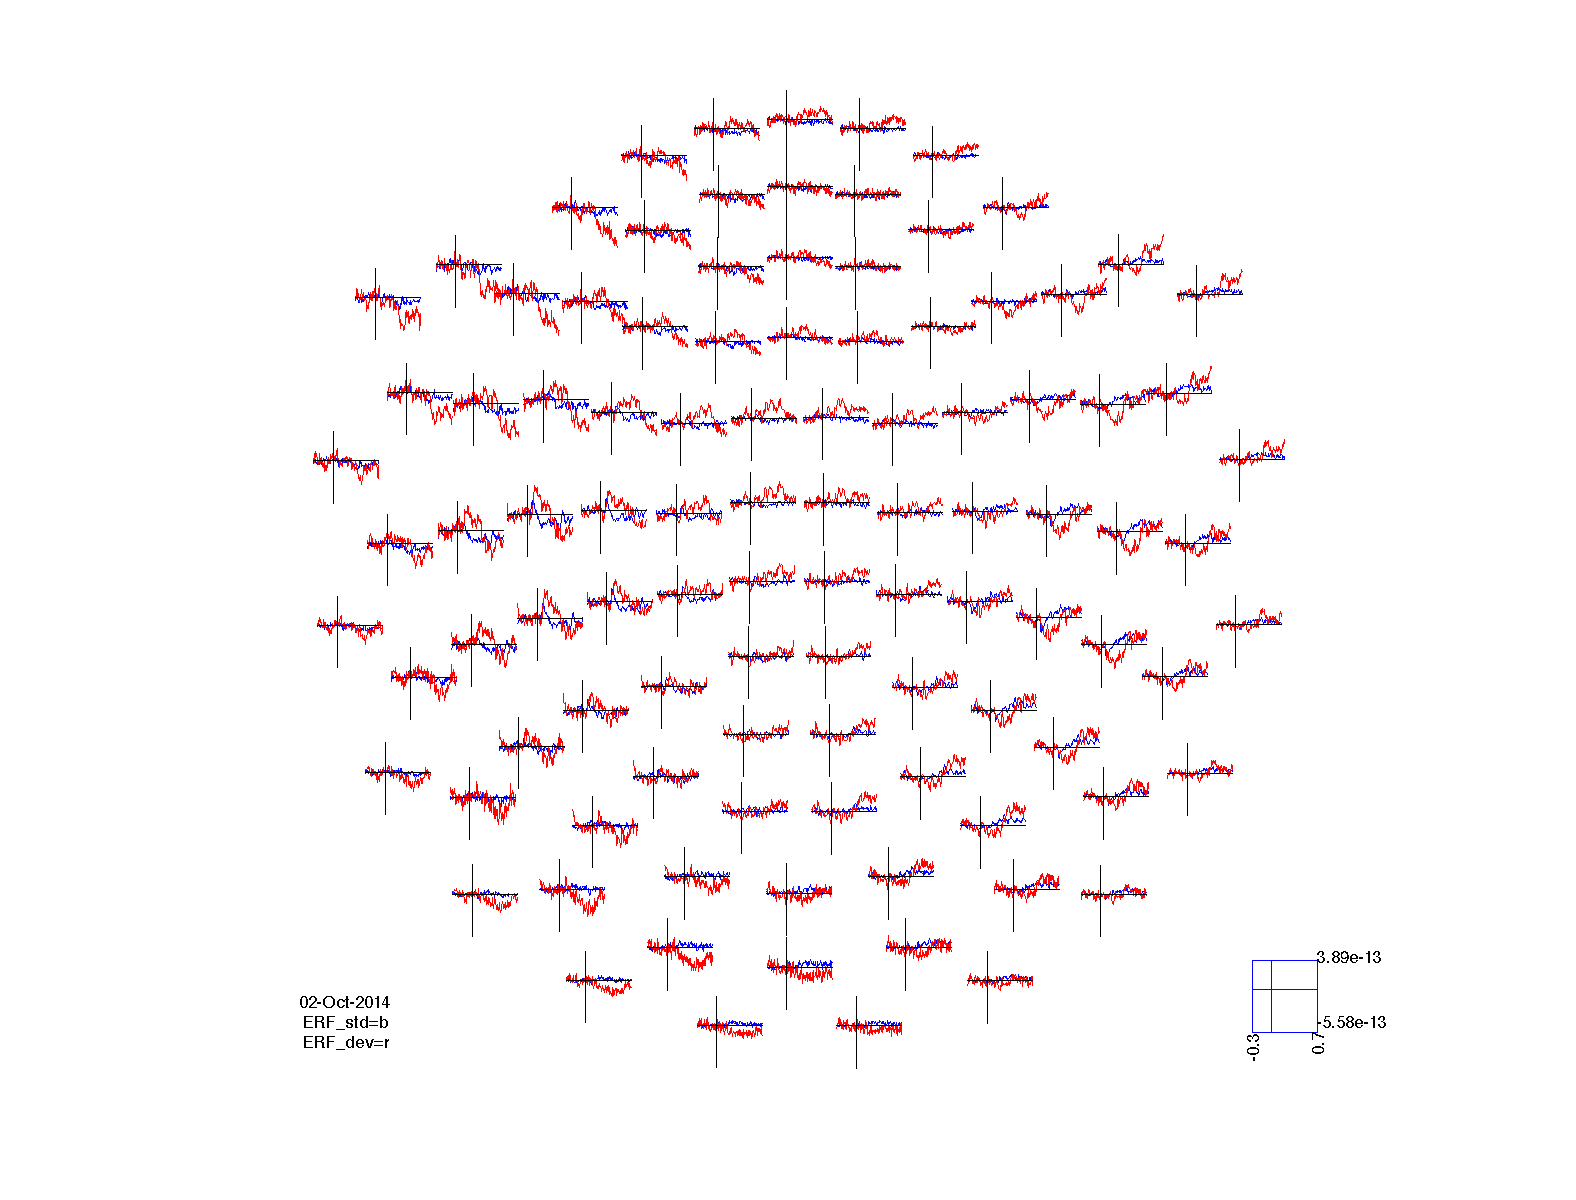
figure; ft_multiplotER(cfg, ERF_std, ERF_dev);
To assess whether there is a significant difference between the two conditions, we also need to know what the variance in the data is. In principle we could use the variance that is estimated by ft_timelockanalysis and manually compute the t-test.
disp(ERF_std)

   avg: [102x251 double]
   var: [102x251 double]
  time: [1x251 double]
   dof: [102x251 double]
 label: {102x1 cell}
dimord: 'chan_time'
  grad: [1x1 struct]
  elec: [1x1 struct]
   cfg: [1x1 struct]
However, we will leave the statistical evaluation to the ft_timelockstatistics function, which expects single-trial input in the case of a within-subject test. The ft_timelockanalysis function has the cfg.keeptrials option, which tells the function to keep the individual trials. This basically amounts to a reorganization of the data, since the single trials are also present in the segmented raw data structure.
cfg             = [];
cfg.keeptrials  = 'yes';
ERF_all = ft_timelockanalysis(cfg, data_stimlocked);

disp(ERF_all)

     time: [1x251 double]
    label: {102x1 cell}
    trial: [100x102x251 double]
   dimord: 'rpt_chan_time'
     grad: [1x1 struct]
     elec: [1x1 struct]
trialinfo: [100x3 double]
      cfg: [1x1 struct]
Note that the dimord is rpt_chan_time, i.e. trials by channels by time, which matches with the size of the ERF_all.trial array.
We proceed by computing the statistical test, which returns the t-value, the probability and a binary mask that contains a 0 for all data points where the probability is below the a-prior threshold, and 1 where it is above the threshold. The cfg.design field specifies the condition in which each of the trials is observed. For the indepsamplesT statistic, it should contain 1’s and 2’s.
cfg           = [];
cfg.statistic = 'indepsamplesT';
cfg.design    = zeros(1, size(ERF_all.trialinfo,1));
cfg.ivar      = 1;

cfg.design(ERF_all.trialinfo(:,1)==1) = 1;
cfg.design(ERF_all.trialinfo(:,1)==2) = 2;

cfg.method    = 'analytic';
cfg.correctm  = 'no';
ERF_stat1     = ft_timelockstatistics(cfg, ERF_all);

cfg.method    = 'analytic';
cfg.correctm  = 'bonferroni';
ERF_stat2     = ft_timelockstatistics(cfg, ERF_all);

cfg.method    = 'analytic';
cfg.correctm  = 'fdr';
ERF_stat3     = ft_timelockstatistics(cfg, ERF_all);

cfg.method            = 'montecarlo';
cfg.correctm          = 'cluster';
cfg.numrandomization  = 500; % 1000 is recommended, but that takes longer
cfg.neighbours        = neighbours;
ERF_stat4     = ft_timelockstatistics(cfg, ERF_all);
Visualise the results
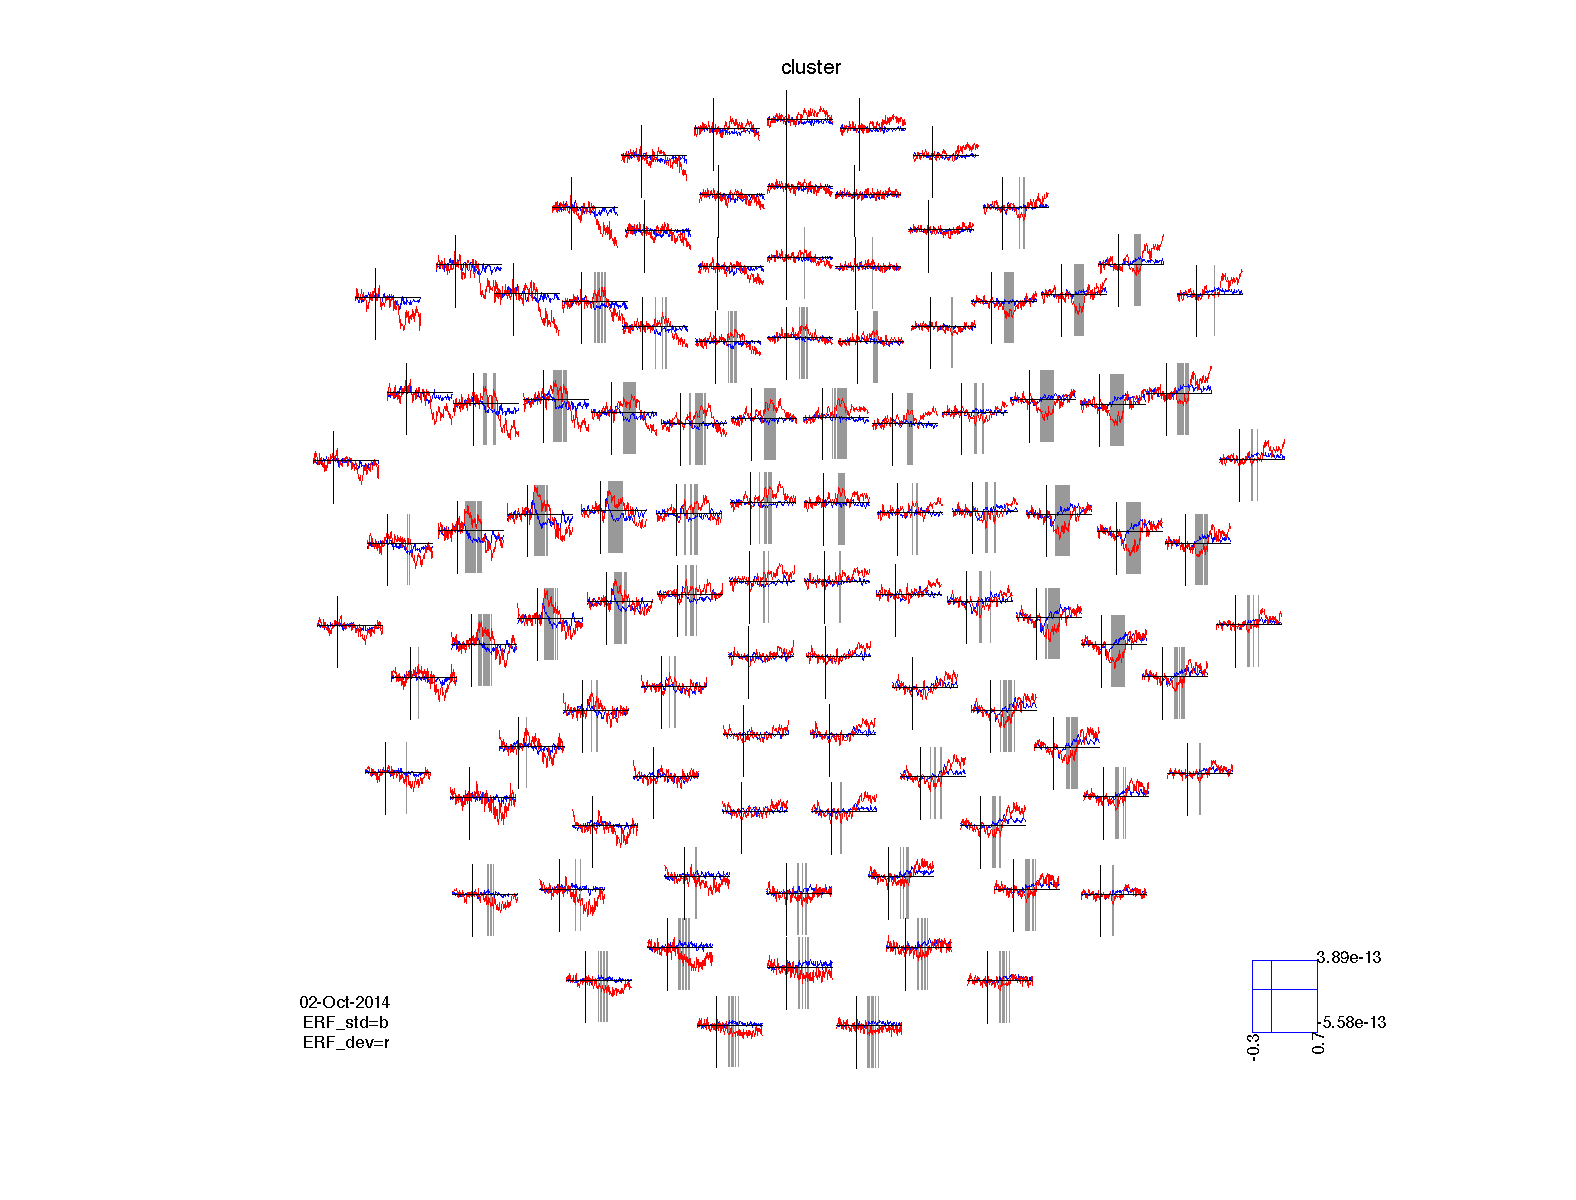
Again we can visualize the results of the statistical comparison. Since we have simple ERF data in two conditions, we can plot the original ERFs in combination with the statistical significance. The ft_multiplotER function has a number of options for highlighting the data that is significant. These are specified using the cfg.maskstyle parameter.
cfg = [];
cfg.layout        = 'neuromag306mag.lay';
cfg.maskparameter = 'mask';
cfg.maskstyle     = 'box';

ERF_std.mask = ERF_stat1.mask;  % copy the significance mask into the ERF
figure; ft_multiplotER(cfg, ERF_std, ERF_dev);
title('no correction');

ERF_std.mask = ERF_stat2.mask;  % copy the significance mask into the ERF
figure; ft_multiplotER(cfg, ERF_std, ERF_dev);
title('bonferroni');

ERF_std.mask = ERF_stat3.mask;  % copy the significance mask into the ERF
figure; ft_multiplotER(cfg, ERF_std, ERF_dev);
title('fdr');

ERF_std.mask = ERF_stat4.mask;  % copy the significance mask into the ERF
figure; ft_multiplotER(cfg, ERF_std, ERF_dev);
title('cluster');
This tutorial demonstrated how to do the statistical analysis on the MEG channels that are present in the dataset. You can repeat the similar procedure for the EEG channels.
Summary and conclusion
This tutorial showed you how to perform parametric and non-parametric statistics in FieldTrip. It addresses multiple ways of dealing with the multiple comparison problem. Furthermore, it demonstrated how to plot the part of the data that show the significant effect.
Suggested further reading
Tutorials:
- Cluster-based permutation tests on time-frequency data
- Cluster-based permutation tests on event-related fields
- Parametric and non-parametric statistics on event-related fields
- Introduction to the FieldTrip toolbox
- Statistical analysis and multiple comparison correction for combined MEG/EEG data
FAQs:
- How can I define neighbouring sensors?
- How can I determine the onset of an effect?
- How to test an interaction effect using cluster-based permutation tests?
- How can I test for correlations between neuronal data and quantitative stimulus and behavioral variables?
- How can I test whether a behavioral measure is phasic?
- How can I use the ivar, uvar, wvar and cvar options to precisely control the permutations?
- How does a difference in trial numbers per condition affect my statistical test
- How NOT to interpret results from a cluster-based permutation test
- Should I use t or F values for cluster-based permutation tests?
- What is the idea behind statistical inference at the second-level?
- Why should I use the cfg.correcttail option when using statistics_montecarlo?
Example scripts:
- Apply non-parametric statistics with clustering on TFRs of power that were computed with BESA
- Computing and reporting the effect size
- Using General Linear Modeling on time series data
- Using General Linear Modeling over trials
- Defining electrodes as neighbours for cluster-level statistics
- Using GLM to analyze NIRS timeseries data
- Using simulations to estimate the sample size for cluster-based permutation test
- Source statistics
- Stratify the distribution of one variable that differs in two conditions
- Using threshold-free cluster enhancement for cluster statistics
- Use simulated ERPs to explore cluster statistics
