development / project / wizard /
Implement a graphical user interface as a "wizard" for certain analysis protocols
The purpose of this page is just to serve as todo or scratch pad for the development project and to list and share some ideas.
After making changes to the code and/or documentation, this page should remain on the website as a reminder of what was done and how it was done. However, there is no guarantee that this page is updated in the end to reflect the final state of the project
So chances are that this page is considerably outdated and irrelevant. The notes here might not reflect the current state of the code, and you should not use this as serious documentation.
This project has been completed, the documentation below is only provided for future reference.
The idea is to make a graphical user interface that allows the user to step through a sequence of functions, where for example each block consists of a computation with the associated graphical feedback. e.g., consider the following analysis protocol:
%%%%%%%%%%%%%%%%%%%%%%%%%%%%%%%%%%%%%%%%%%%%%%%%%%%%%%%%%%%%%%%%%%%%%%%%%%%%%%%%%%%%%%%%
% Step 1: do the preprocessing
%
% The first step is to read the data using the function FT_PREPROCESSING. With the aim to
% reduce boundary effects occurring at the start and the end of the trials, it is
% recommended to read larger time intervals than the time period of interest.
% In this example, the time of interest is from -0.5 s to 1.5 s (t = 0 s defines the time
% of stimulus); however, the script reads the data from -1 s to 2.0
cfg = [];
cfg.dataset = 'Subject01.ds';
cfg.trialdef.eventtype = 'backpanel trigger';
cfg.trialdef.prestim = 1;
cfg.trialdef.poststim = 2;
cfg.trialdef.eventvalue = 3;
cfg = definetrial(cfg);
cfg.channel = {'MEG'};
dataFIC = preprocessing(cfg);
%%%%%%%%%%%%%%%%%%%%%%%%%%%%%%%%%%%%%%%%%%%%%%%%%%%%%%%%%%%%%%%%%%%%%%%%%%%%%%%%%%%%%%%%
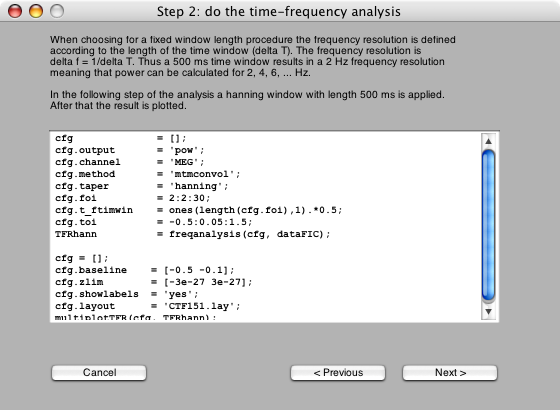
% Step 2: do the time-frequency analysis
%
% When choosing for a fixed window length procedure the frequency resolution is defined
% according to the length of the time window (delta T). The frequency resolution is
% delta f = 1/delta T. Thus a 500 ms time window results in a 2 Hz frequency resolution
% meaning that power can be calculated for 2, 4, 6, ... Hz.
%
% In the following step of the analysis a hanning window with length 500 ms is applied.
% After that the result is plotted.
cfg = [];
cfg.output = 'pow';
cfg.channel = 'MEG';
cfg.method = 'mtmconvol';
cfg.taper = 'hanning';
cfg.foi = 2:2:30;
cfg.t_ftimwin = ones(length(cfg.foi),1).*0.5;
cfg.toi = -0.5:0.05:1.5;
TFRhann = freqanalysis(cfg, dataFIC);
cfg = [];
cfg.baseline = [-0.5 -0.1];
cfg.zlim = [-3e-27 3e-27];
cfg.showlabels = 'yes';
cfg.layout = 'CTF151.lay';
multiplotTFR(cfg, TFRhann);
Using the wizard on this analalysis protocol would result in a graphical user interface like this:
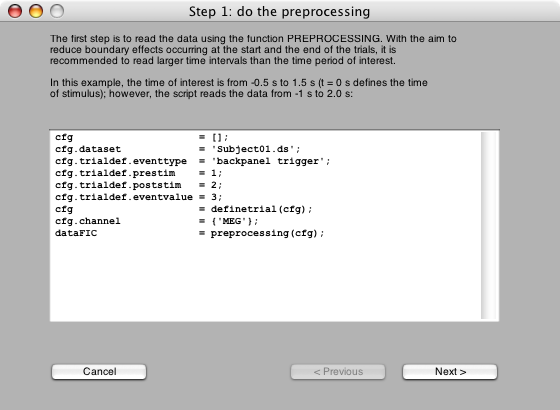
Pressing the “next” button would result in the snippet of MATLAB code inside the edit box to be executed, pressing the “previous” button results in going one step back. The code would be executed in the main MATLAB workspace as if it were a normal script, which means that the variable names are also defined in the wizard. Loading and saving data from/to files would also be easy to implement using the standard MATLAB “uigetfile” function.
The wizard would have to read and parse the MATLAB script that contains the documentation and the code, and it would have to detect the sections by the “%%%%%” separators. To make a useful wizard using this graphical interface would then only require making example MATLAB scripts with a well-defined structure with comments and with code.
Ideas for further refinement
When the wizard has reached the end of the script, it would have to show that it is finished. Perhaps the code execution can be done in a separate workspace and all variables copied to the main workspace when finished.
Using a key combination (e.g., Ctrl-R) the script can be reloaded.
Using a key combination (e.g., Ctrl-S) the modifications made to the script using the GUI can be saved.
If graphical display of the data does not apply to a specific step, then the textual output could be displayed in a dialog with only an “OK” button.