documentation / example / spectral / fooof /
Fitting oscillations and one-over-F (FOOOF)
FOOOF allows distinguishing rhythmic activity from concurrent power-spectral 1/f modulations. The implementation in FieldTrip is using code from the Brainstorm toolbox. The Brainstorm website has a tutorial that provides some more details, there is a GitHub project with more tutorials and documentation, and the FOOOF reference paper explains and demonstrates it.
The following code shows how to extract spectral features from simulated data.
rng(42)
% set simulation parameters
A = 1; % scale of 1/f amplitude
C = 1; % 1/f slope
O = 1; % weight of oscillatory components of the simulated data
lf = 0; % lower bound of freq
hf = 500; % higher bound of freq
sl = 500; % spectral lines
fs = 1000; % sampling rate
n = 60000; % time pnts
t = ((1:n)-1)/fs; % time axis
% simulate data
freq = linspace(lf, hf, sl+1); % sampled frequencies for simulated noise
fn = zeros(size(t));
for i=2:length(freq) % cumulative sum over freq, but don't include the DC
fn = fn + sqrt(A * (1/freq(i)^C)) * cos(2*pi*freq(i)*t + rand*2*pi); % 1/f power = a*(1/f^c)
end
% add a 10Hz and 60 Hz oscillation
data.trial{1} = fn + O * cos(2*pi*10.7*t) + O * cos(2*pi*60.3*t);
data.time{1} = t;
data.label{1} = 'chan';
% chunk 2-second segments (gives 1Hz frequency resolution) for long/continous trials
cfg = [];
cfg.length = 2; % freqency resolution = 1/2^floor(log2(cfg.length*0.9))
cfg.overlap = 0.5;
data = ft_redefinetrial(cfg, data);
% compute the fractal and original spectra
tic
cfg = [];
%cfg.taper = 'hanning';
cfg.tapsmofrq = 1;
cfg.pad = 5;
cfg.method = 'mtmfft';
cfg.output = 'fooof_aperiodic';
fractal = ft_freqanalysis(cfg, data);
cfg.output = 'pow';
original = ft_freqanalysis(cfg, data);
toc % ~28s
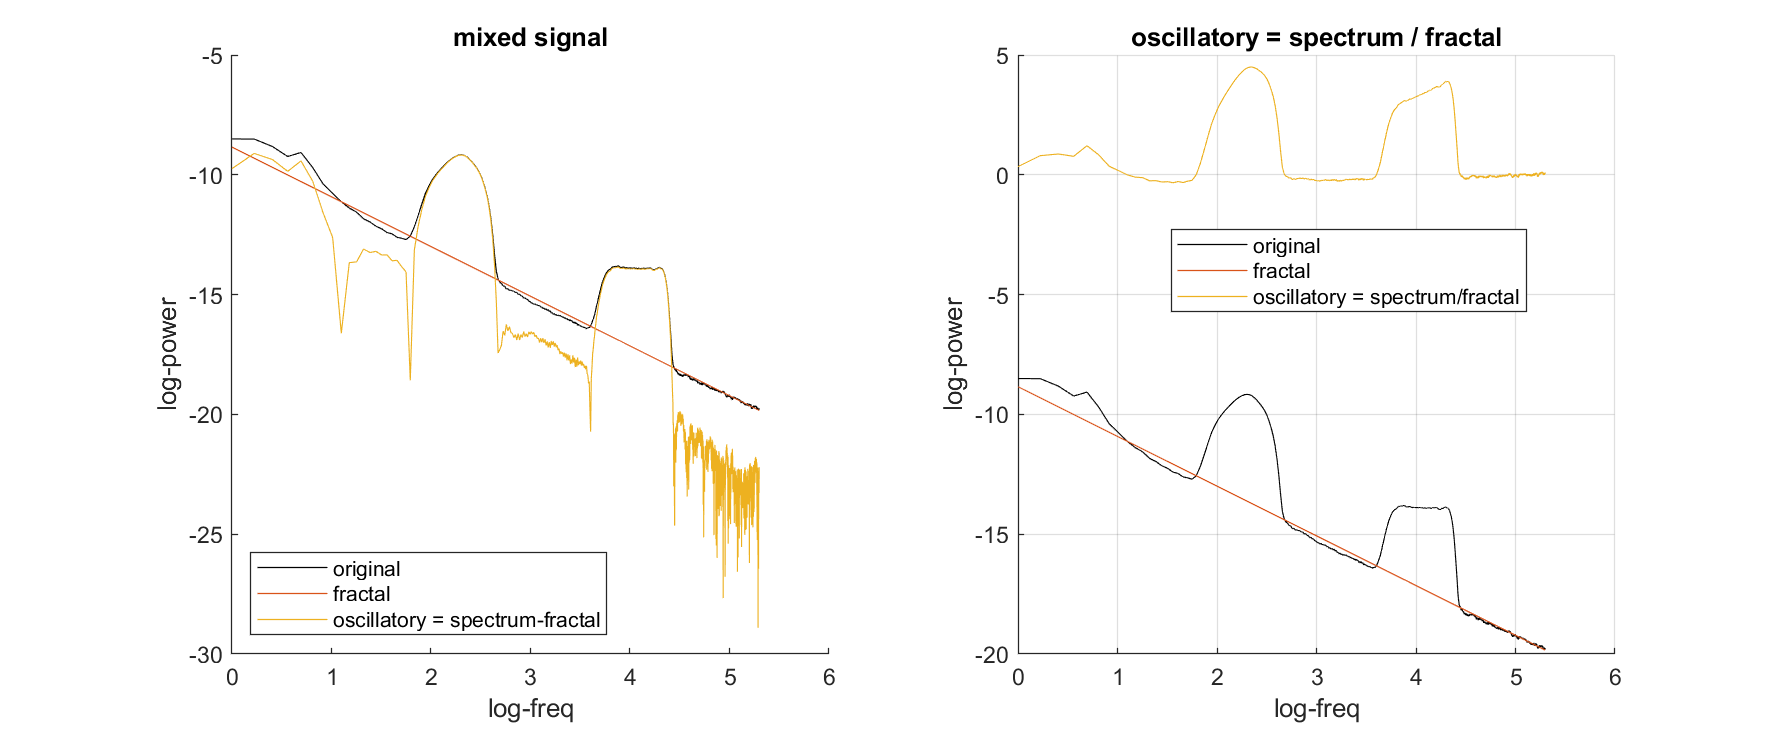
% subtract the fractal component from the power spectrum
cfg = [];
cfg.parameter = 'powspctrm';
cfg.operation = 'x2-x1';
oscillatory = ft_math(cfg, fractal, original);
% display the spectra in log-log scale
figure();
hold on;
plot(log10(original.freq), log10(original.powspctrm),'k');
plot(log10(fractal.freq), log10(fractal.powspctrm));
plot(log10(fractal.freq), log10(oscillatory.powspctrm));
xlabel('log10-freq'); ylabel('log10-power');
legend({'original','fractal','oscillatory'},'location','southwest');
p = polyfit(log10((fractal.freq(2:end))),log10((fractal.powspctrm(2:end))),1);
fprintf('fitted slope = %d\n', p(1));
fprintf('fitted intercept = %d\n', p(2));
if A~=0 && O==0
title('pure fractal signal');
elseif A==0 && O~=0
title('pure oscillatory signal');
elseif A~=0 && O~=0
title('mixed signal');
end