workshop / madrid2019 / eeg_sedation /
Details on the resting-state EEG dataset recorded with different sedation levels
The EEG resting state dataset was acquired by Srivas Chennu and collaborators in a study investigating reliable brain measures to track the loss of reportable consciousness during propofol sedation. You can find full details in their publication.
They also made the entire dataset available under the CC BY 2.0 UK license from the University of Cambridge Data Repository.
The experimental design is displayed in the figure below.
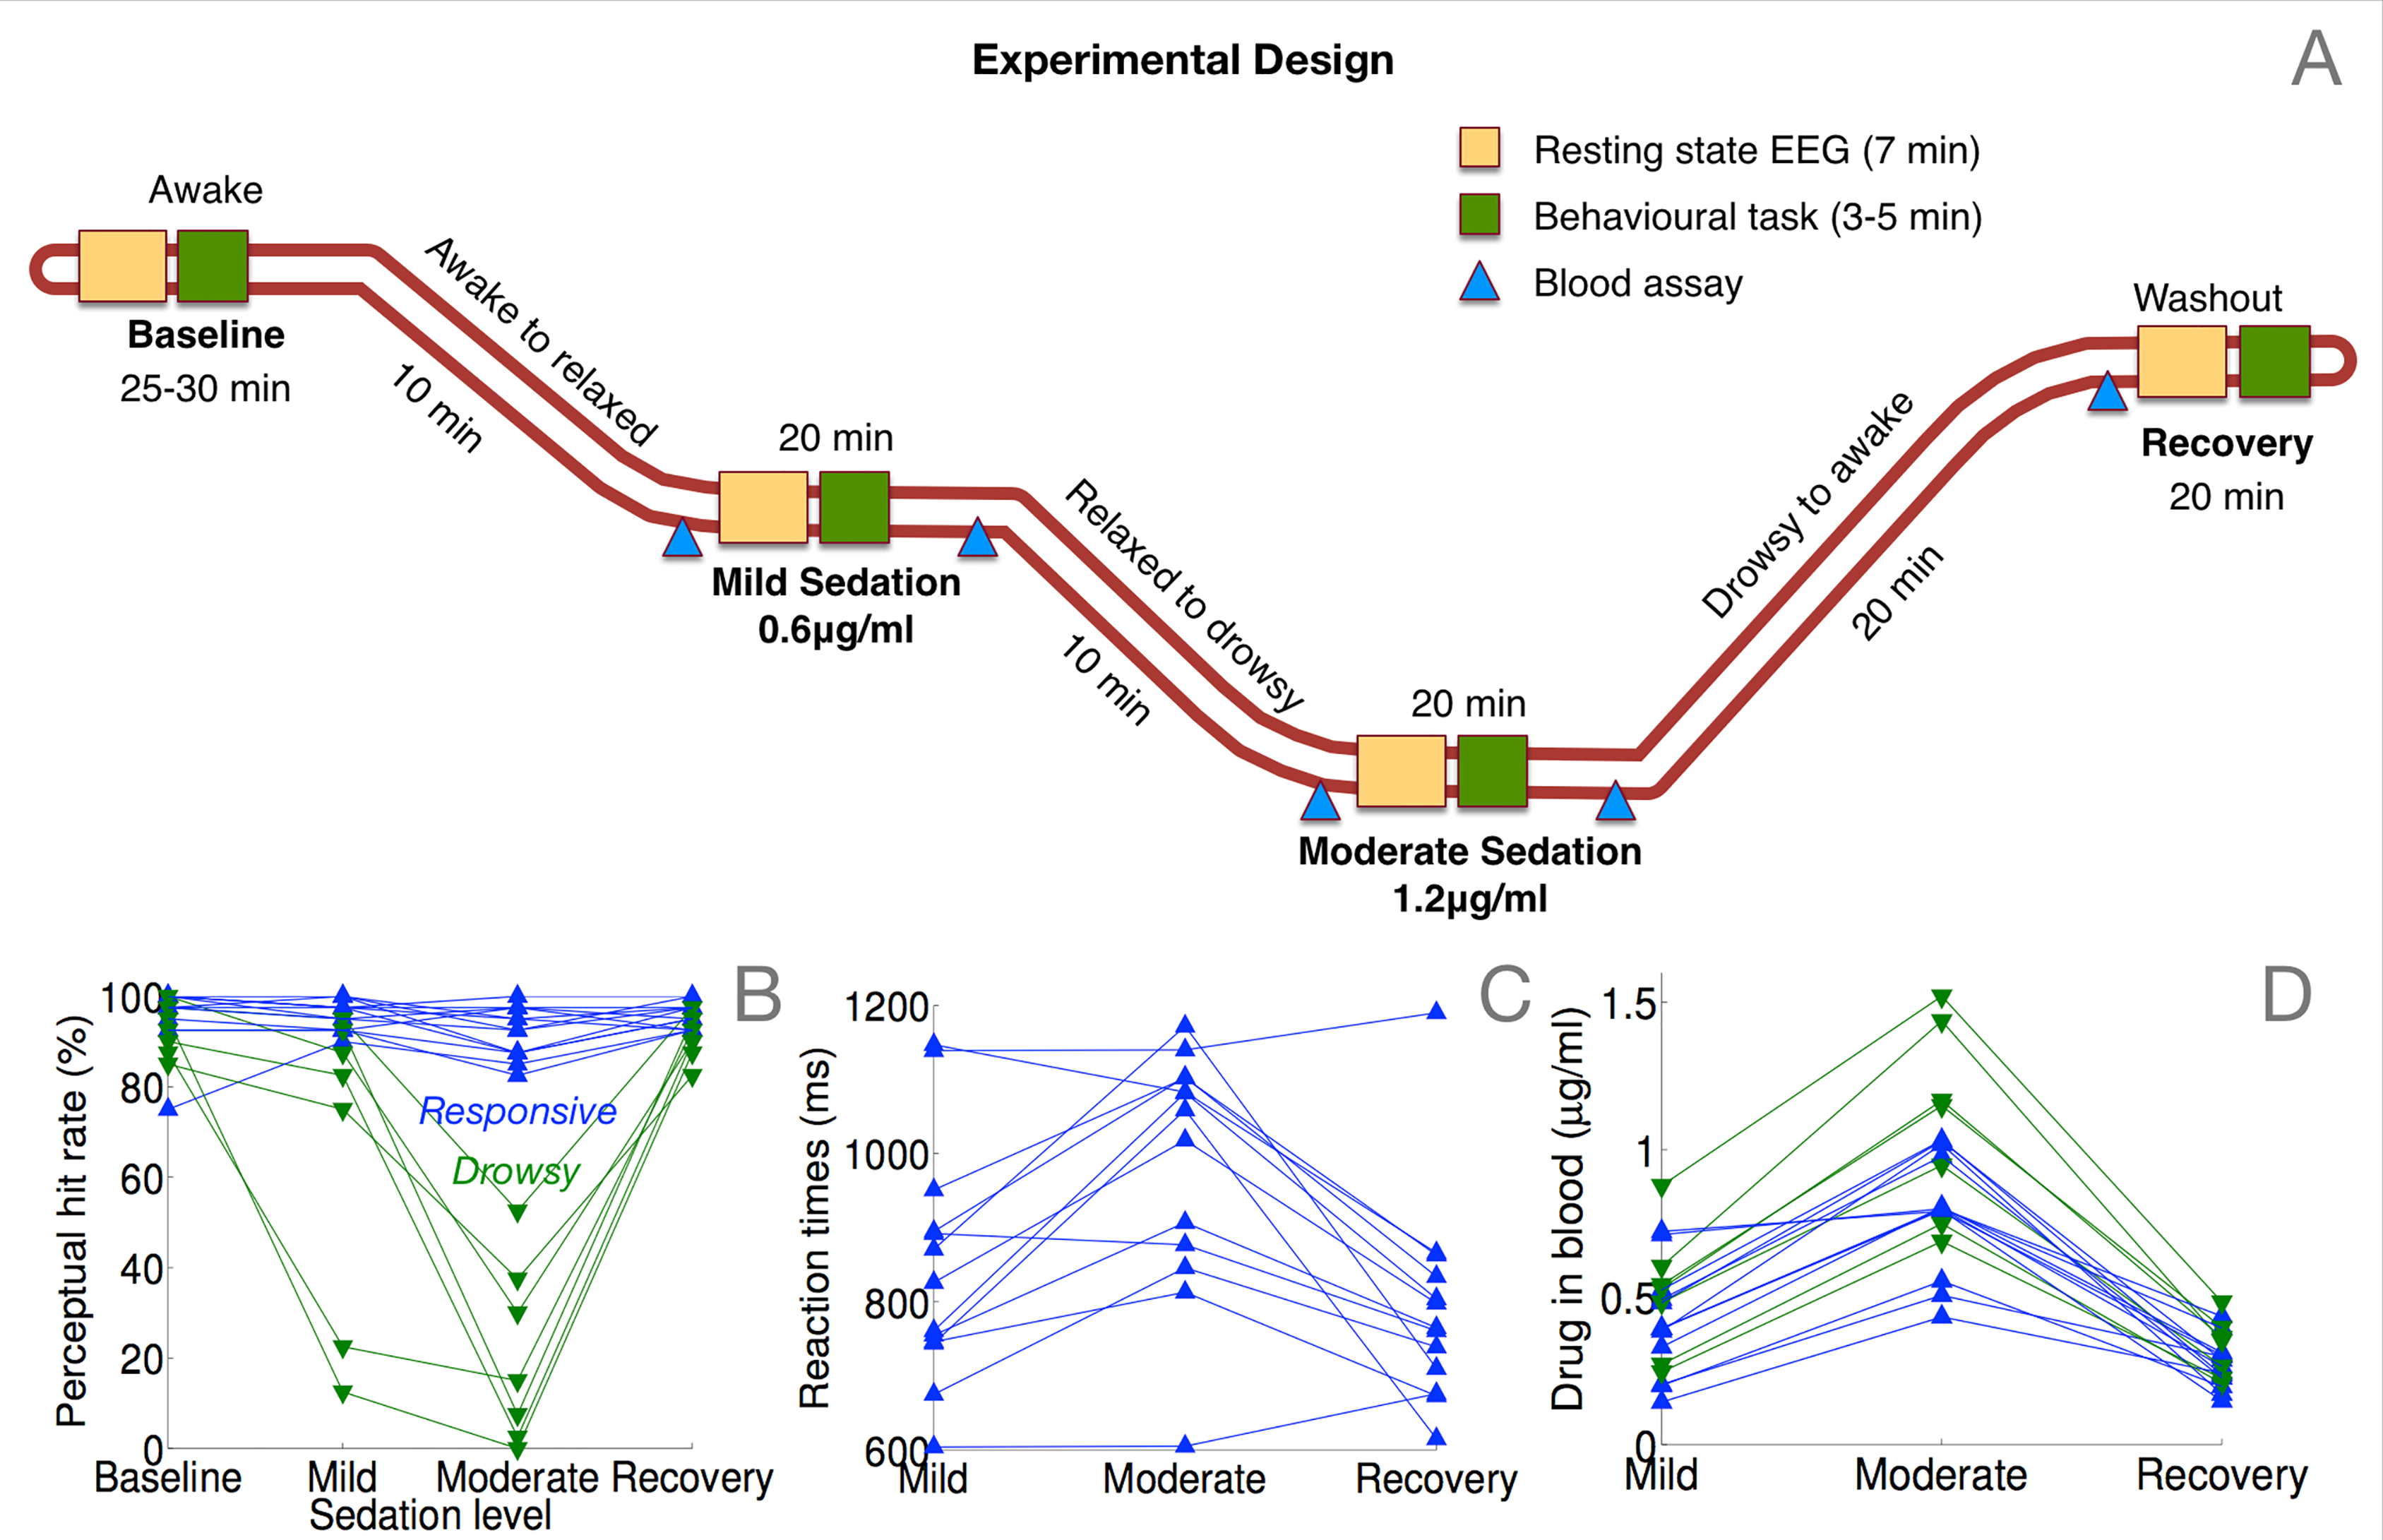
Figure 1. Experimental manipulation and measurement of behavior and propofol concentration in blood plasma.
Briefly, participants remained with the eyes closed while the EEG were acquired during periods around ~7 minutes. They recorded 4 experimental conditions:
- Baseline
- Bild sedation
- Moderate sedation
- Recovery.
In the baseline condition no drug was given. Later they injected participants controlled dosages of propofol to produce from mild (0.6ug/ml) to moderate sedation (1.2ug/ml). After each EEG resting state acquisition was followed by a two-choice speeded response task to assess behavioural responsiveness. The information about the hit rate, reaction time and drug dosage will be used in the statistics tutorial to investigate whether these variables correlate with EEG activity.
128-channel high-density EEG data were collected at each level of sedation. EEG was sampled at 250Hz and referenced to the vertex, using the EGI NetAmps 300 amplifier.
In their original analysis the raw data was preprocessed using EEGLAB and data from 91 channels over the scalp surface were retained for further analysis. Channels on the neck, cheeks and forehead were excluded. The data was filtered between 0.5–45 Hz, and segmented into 10-second long epochs. Each epoch thus generated was baseline-corrected relative to the mean voltage over the entire epoch. Data containing excessive eye movement or muscular artifacts were rejected by a quasi-automated procedure: abnormally noisy channels and epochs were identified by calculating their normalized variance and then manually rejected or retained by visual inspection. Finally, previously rejected channels were interpolated using spherical spline interpolation, and data were rereferenced to the average of all channels.
The baseline correction following segmentation means that there are (possibly small) jumps in each channel at the segment boundaries. When reading and segmenting this data, you should ensure that your segments are aligned with the 10-second segments used in the original preprocessing.