workshop / natmeg2014 / meg_audodd /
Details of the auditory oddball combined MEG/EEG dataset
For the 2014 EEG-MEG workshop at NatMEG we recorded a dataset of a single subject to allow you to work through all the different steps involved in EEG and MEG analysis: from event-related averaging to frequency analysis, source modeling and statistics.
The oddball paradigm
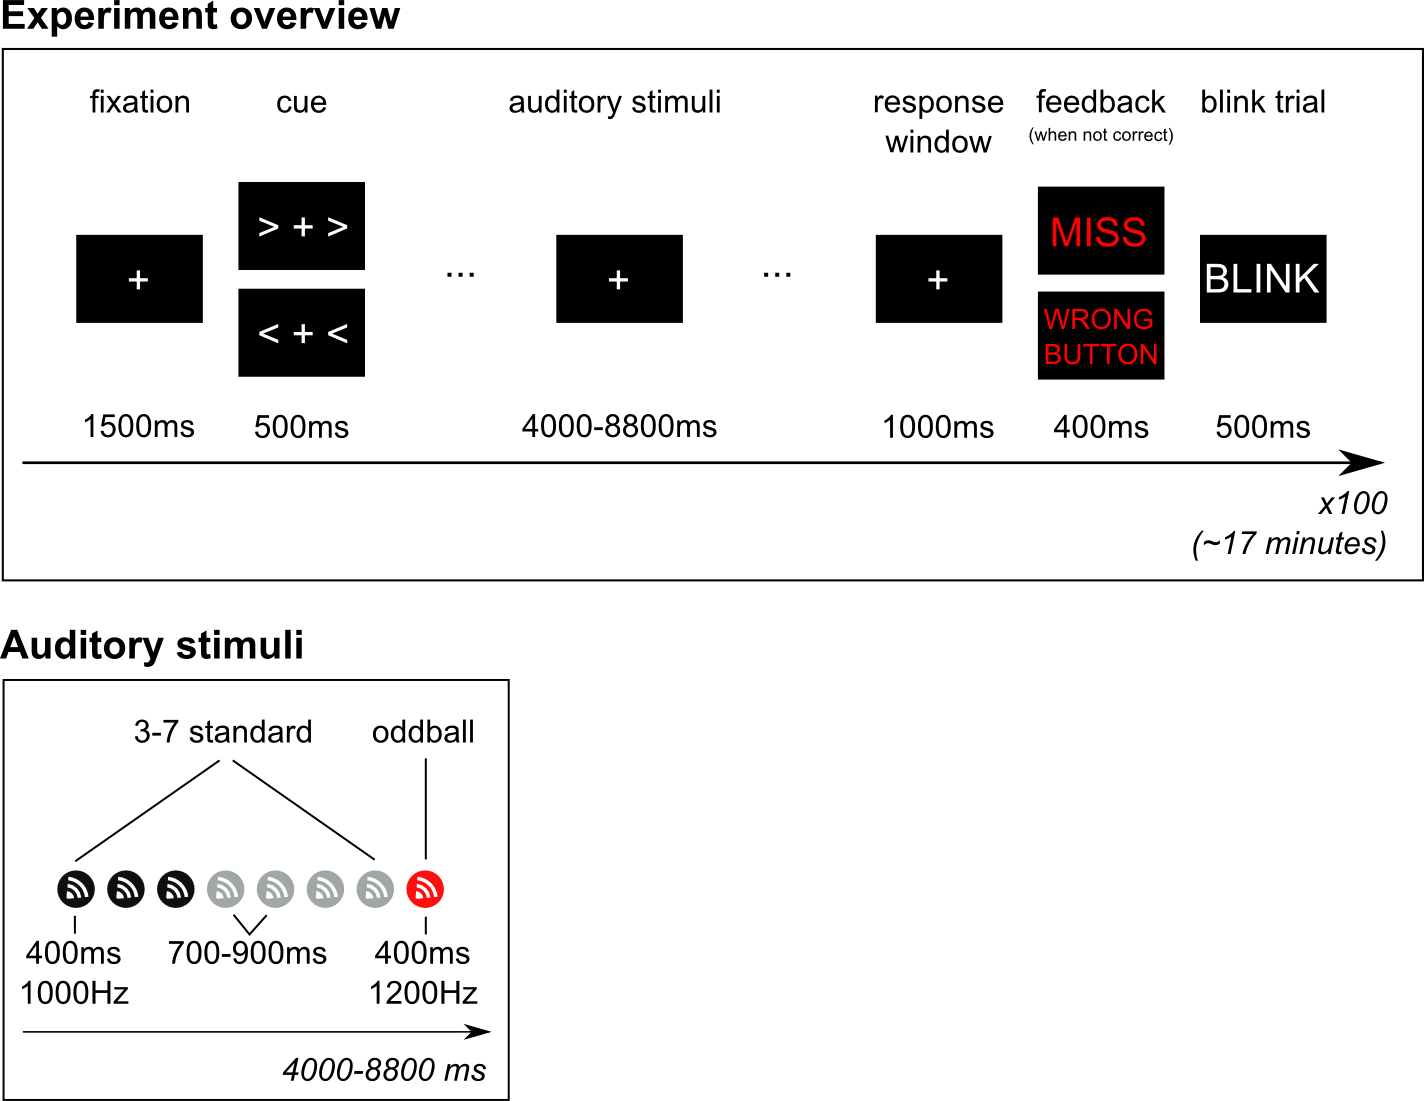
The experiment that the subject performed is a slight adaptation of the classical oddball experiment. Using the oddball paradigm one can study the well-known EEG component called the mismatch-negativity (MMN). The classical auditory oddball experiment involves the presentation of a continuous series of identical tones at a relatively slow rate, say between one every two seconds to two every second. Every so often, say one out of ten, the tone is slightly different in pitch, duration or loudness. In our version, an oddball occurs after every 3 to 7 standard tones. The interval between each tone is jittered between 700 to 900 ms.
Mismatch negativity
The auditory MMN then occurs as a fronto-central negative EEG potential (relative to the response to the standard tone), with sources in the primary and non-primary auditory cortex and a typical latency of 150-250 ms after the onset of the deviant tone. Not only is the MMN an indicator or auditory functioning, it has also been shown to be under influence of cognitive factors and indicative of cognitive and psychiatric impairments. For a recent and comprehensive overview please see Näätänen et al (2007).
Cued motor preparation
For the purpose of analyzing oscillatory dynamics we wanted the oddball paradigm to include motor responses, specifically left and right button-presses with the left and right index finger, respectively. The subject was therefor cued to respond with their left or right index finger whenever, and as soon as possible, after a deviant tone occurred. The experiment therefore consistent of series of standard tones + deviant, preceded by a cue (left or right), and followed by a button-press.
Beta suppression and rebound
It is well known that power in the beta band (15–30 Hz) decreases prior to movement onset but showed a marked sudden increase beginning approximately 300 to 400 ms after termination of EMG activity and lasting for over 500 ms. This post-movement beta rebound (PMBR) is localized to bilateral regions of the pre-central gyrus, but with greater lateralization to the contralateral hemisphere. Contrasting left versus right responses should therefor give us a nice lateralized beta rebound in the pre-central gyrus.
For a recent overview of sensorimotor rhythms, including the beta rebound, please see Cheyne (2013).
Training with feedback and blink trials
Before the recording, the subject performed the experiment in a short training session to get acquainted with the task. Whenever the subject was too late in responding (>2 seconds), or pressed the wrong button, feedback was provided. In the actual experiment the subject was always on time and responded with the correct hand each time.
Finally, after each response, a blink trial is presented in which subjects are asked to blink so that they can remain fixated on the fixation cross - without blinking - throughout the period in time in which we are interested in the brain signal.
Stimuli
The standard tones were 400ms 1000Hz sine-waves, with a short 50ms ramping up- and down to avoid a clicking sound. The oddball tones were identical except for being 1200Hz. The auditory stimuli are presented with an external device that stores uncompressed audio files (.wav) that can then be presented with sub-millisecond precision (in effect instantaneous). Sound was presented through flat-panel sound showers. We measured the duration between the arrival of the triggers (see below) in the data and the arrival of the sound through the air to the ears of the subject. This takes 7.0 ms.
Triggers
The MEG system records event-triggers in a separate channels, called STI101 and STI102. These channels are recorded simultaneously with the data channels, and at the same sampling rate. The onset (or offset) can therefore be precisely timed with respect to the data. The following trigger codes can be used for the analysis we will be doing during the workshop:
- Onset of standard stimulus: 1
- Onset of oddball stimulus: 2
- Button-press onset of left hand: 256
- Button-press onset of right hand: 4096
Data
- Data was sampled at 1000Hz.
- 306 channels MEG of which 102 are magnetometers, and 204 are planar gradiometers.
- 128 electrode EEG. The reference was placed on the right mastoid, the ground on the left mastoid. The locations of the electrodes are placed according to the 5% system, which is an extension of the standard 10-20 system for high-density EEG caps. You can find details in Oostenveld and Praamstra, (2001). In addition, the locations of the EEG electrodes was measured in 3D using the Polhemus system and recorded in the data.
- Horizontal EOG(1) electrodes were placed just outside the left and right eye. Vertical EOG(2) were placed above and below the left eye.
- Electrocardiogram (ECG) was recorded as a bipolar recording from the collarbones.
- Electromyography of the lower arm flexors of the left(1) and right(2) arm were recorded.